%20--%3e%3cpath%20d='M17.73,0v114.51H0V0h17.73Z'/%3e%3cpath%20d='M51.88,114.5h-16.47V26.14h14.33l.72,7.34c4.84-5.91,11.46-8.95,19.52-8.95,14.68,0,22.92,10.74,22.92,30.98v59h-16.47v-58.64c0-11.82-3.94-16.65-11.46-16.65-6.09,0-10.39,3.04-13.07,6.98v68.3h-.02Z'/%3e%3cpath%20d='M124.94,114.5h-16.47V26.14h14.33l.72,7.34c4.84-5.91,11.46-8.95,19.52-8.95,14.68,0,22.92,10.74,22.92,30.98v59h-16.47v-58.64c0-11.82-3.94-16.65-11.46-16.65-6.09,0-10.39,3.04-13.07,6.98v68.3h-.02Z'/%3e%3cpath%20d='M236.85,86.39c0,17.01-9.85,29.72-28.83,29.72s-28.83-12.53-28.83-29.72v-31.78c0-17.19,9.67-30.08,28.83-30.08s28.83,12.71,28.83,30.08v31.78ZM195.49,85.67c0,11.28,4.12,16.83,12.53,16.83s12.36-5.55,12.36-16.83v-30.53c0-11.28-3.94-16.83-12.36-16.83s-12.53,5.55-12.53,16.83v30.53Z'/%3e%3cpath%20d='M250.1,46.02c4.48-12.71,12.89-21.67,26.5-21.67,17.01,0,24.17,11.64,24.17,28.47v44.67c0,3.94,1.79,6.27,5.37,6.27h0l4.06,10.01c-3.09,1.3-7.1,1.81-9.79,1.81-6.8,0-10.92-3.04-13.43-7.16-4.83,5.19-10.92,7.52-18.08,7.52-12.89,0-21.13-9.85-21.13-24.89,0-16.47,8.59-29.19,32.05-29.19h4.48v-9.22c0-10.56-3.22-14.5-9.85-14.5-5.73,0-10.21,4.12-13.25,12.89l-11.1-5.01ZM284.3,97.13v-23.1h-4.48c-12,0-16.29,5.73-16.29,15.58,0,10.56,3.76,13.97,9.31,13.97,5.2,0,8.6-2.15,11.46-6.45Z'/%3e%3cpath%20d='M356.82,50.85c-2.15-8.95-6.44-12.35-12.18-12.35-7.7,0-12.36,4.83-12.36,16.65v30.35c0,11.82,4.48,16.83,12.36,16.83,6.09,0,10.03-3.58,12.36-12.89l12.36,3.94c-3.58,14.32-12.36,22.74-26.14,22.74-18.26,0-27.22-13.61-27.22-29.9v-31.6c0-16.83,9.13-30.08,27.22-30.08,12.89,0,22.2,8.24,25.78,22.2l-12.18,4.11Z'/%3e%3cpath%20d='M416.63,43.15h-17.01v48.61c0,7.34,3.4,10.92,9.13,10.92,2.33,0,3.38-.11,4.47-.54l3.76,9.85c-3.76,2.33-8.42,3.94-14.15,3.94-13.61,0-19.7-8.41-19.7-24.71v-47.18l-9.31-2.33v-11.63l10.21-.72.57-14.93,15.01-4.77v20.05h17.01v13.44h0Z'/%3e%3cpath%20d='M446.53,26.14v88.36h-16.47V26.14h16.47ZM445.64,0v17.55h-14.86V0h14.86Z'/%3e%3cpath%20d='M500.79,114.5h-18.8l-24.35-88.36h18.08l15.76,72.07,15.94-72.07h18.08l-24.71,88.36Z'/%3e%3cpath%20d='M548.06,73.41v12.08c0,11.28,4.66,16.83,13.25,16.83,6.8,0,10.56-3.76,13.43-14.15l12.36,3.94c-3.76,16.29-12.36,23.99-27.4,23.99-18.26,0-27.93-12.89-27.93-30.08v-31.6c0-16.83,9.49-29.9,27.93-29.9s27.04,13.25,27.04,30.62v18.26h-38.68ZM548.06,62.49h23.82v-8.77c0-10.74-4.12-15.76-11.82-15.76-8.24,0-12,5.19-12,15.76v8.77Z'/%3e%3cpath%20d='M614.75,107.12c0,4.4-3.69,8.99-8.77,8.99s-8.77-4.59-8.77-8.99v-1.23c0-4.4,3.62-8.92,8.77-8.92s8.77,4.52,8.77,8.92v1.23ZM599,107.12c0,3.88,2.87,7.2,6.9,7.2s7.13-3.32,7.13-7.2v-1.23c0-3.95-2.95-7.28-7.13-7.28s-6.9,3.32-6.9,7.28v1.23ZM605.91,107.94h-1.34v3.77h-2.31v-10.86h4.03c2.69,0,3.95,1.34,3.95,3.51,0,1.64-.75,2.84-2.16,3.21l2.61,4.14h-2.46l-2.32-3.77ZM604.56,106.3h1.64c1.27,0,1.64-.67,1.64-1.87s-.37-1.72-1.64-1.72h-1.64v3.59Z'/%3e%3c/svg%3e)
Innoactive Portal features
Adoption, ROI, and learning analytics in one place
Performance, adoption, and ROI tracking for VR training and design-review rollouts — plus deep XR learning analytics via Cognitive3D.
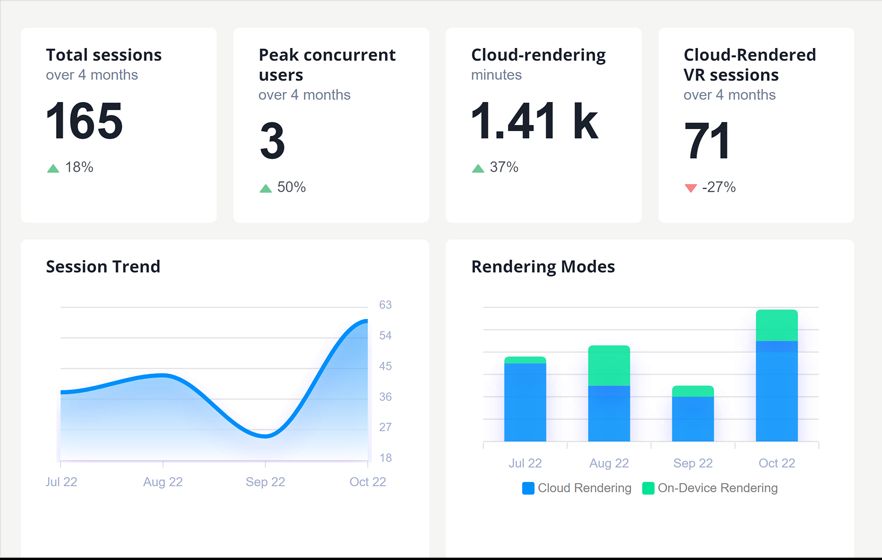
The analytics dashboard answers the two questions every XR program eventually faces: who's using it and is it working. Portal-native metrics for adoption, Cognitive3D for what's happening inside the scene.
Highlights
- Session and adoption analytics — sessions per user, per group, per scene, per device — out of the box.
- Cognitive3D integration for in-scene learning events: gaze, dwell, decision points, objective completion.
- Export to your BI stack — every metric is available via the Portal API or a CSV/Parquet drop.
Related products
Try Innoactive Portal with Analytics dashboard
Start a 30-day trial and we'll stand up your first Analytics dashboard session on your own data within two business days.