%20--%3e%3cpath%20d='M17.73,0v114.51H0V0h17.73Z'/%3e%3cpath%20d='M51.88,114.5h-16.47V26.14h14.33l.72,7.34c4.84-5.91,11.46-8.95,19.52-8.95,14.68,0,22.92,10.74,22.92,30.98v59h-16.47v-58.64c0-11.82-3.94-16.65-11.46-16.65-6.09,0-10.39,3.04-13.07,6.98v68.3h-.02Z'/%3e%3cpath%20d='M124.94,114.5h-16.47V26.14h14.33l.72,7.34c4.84-5.91,11.46-8.95,19.52-8.95,14.68,0,22.92,10.74,22.92,30.98v59h-16.47v-58.64c0-11.82-3.94-16.65-11.46-16.65-6.09,0-10.39,3.04-13.07,6.98v68.3h-.02Z'/%3e%3cpath%20d='M236.85,86.39c0,17.01-9.85,29.72-28.83,29.72s-28.83-12.53-28.83-29.72v-31.78c0-17.19,9.67-30.08,28.83-30.08s28.83,12.71,28.83,30.08v31.78ZM195.49,85.67c0,11.28,4.12,16.83,12.53,16.83s12.36-5.55,12.36-16.83v-30.53c0-11.28-3.94-16.83-12.36-16.83s-12.53,5.55-12.53,16.83v30.53Z'/%3e%3cpath%20d='M250.1,46.02c4.48-12.71,12.89-21.67,26.5-21.67,17.01,0,24.17,11.64,24.17,28.47v44.67c0,3.94,1.79,6.27,5.37,6.27h0l4.06,10.01c-3.09,1.3-7.1,1.81-9.79,1.81-6.8,0-10.92-3.04-13.43-7.16-4.83,5.19-10.92,7.52-18.08,7.52-12.89,0-21.13-9.85-21.13-24.89,0-16.47,8.59-29.19,32.05-29.19h4.48v-9.22c0-10.56-3.22-14.5-9.85-14.5-5.73,0-10.21,4.12-13.25,12.89l-11.1-5.01ZM284.3,97.13v-23.1h-4.48c-12,0-16.29,5.73-16.29,15.58,0,10.56,3.76,13.97,9.31,13.97,5.2,0,8.6-2.15,11.46-6.45Z'/%3e%3cpath%20d='M356.82,50.85c-2.15-8.95-6.44-12.35-12.18-12.35-7.7,0-12.36,4.83-12.36,16.65v30.35c0,11.82,4.48,16.83,12.36,16.83,6.09,0,10.03-3.58,12.36-12.89l12.36,3.94c-3.58,14.32-12.36,22.74-26.14,22.74-18.26,0-27.22-13.61-27.22-29.9v-31.6c0-16.83,9.13-30.08,27.22-30.08,12.89,0,22.2,8.24,25.78,22.2l-12.18,4.11Z'/%3e%3cpath%20d='M416.63,43.15h-17.01v48.61c0,7.34,3.4,10.92,9.13,10.92,2.33,0,3.38-.11,4.47-.54l3.76,9.85c-3.76,2.33-8.42,3.94-14.15,3.94-13.61,0-19.7-8.41-19.7-24.71v-47.18l-9.31-2.33v-11.63l10.21-.72.57-14.93,15.01-4.77v20.05h17.01v13.44h0Z'/%3e%3cpath%20d='M446.53,26.14v88.36h-16.47V26.14h16.47ZM445.64,0v17.55h-14.86V0h14.86Z'/%3e%3cpath%20d='M500.79,114.5h-18.8l-24.35-88.36h18.08l15.76,72.07,15.94-72.07h18.08l-24.71,88.36Z'/%3e%3cpath%20d='M548.06,73.41v12.08c0,11.28,4.66,16.83,13.25,16.83,6.8,0,10.56-3.76,13.43-14.15l12.36,3.94c-3.76,16.29-12.36,23.99-27.4,23.99-18.26,0-27.93-12.89-27.93-30.08v-31.6c0-16.83,9.49-29.9,27.93-29.9s27.04,13.25,27.04,30.62v18.26h-38.68ZM548.06,62.49h23.82v-8.77c0-10.74-4.12-15.76-11.82-15.76-8.24,0-12,5.19-12,15.76v8.77Z'/%3e%3cpath%20d='M614.75,107.12c0,4.4-3.69,8.99-8.77,8.99s-8.77-4.59-8.77-8.99v-1.23c0-4.4,3.62-8.92,8.77-8.92s8.77,4.52,8.77,8.92v1.23ZM599,107.12c0,3.88,2.87,7.2,6.9,7.2s7.13-3.32,7.13-7.2v-1.23c0-3.95-2.95-7.28-7.13-7.28s-6.9,3.32-6.9,7.28v1.23ZM605.91,107.94h-1.34v3.77h-2.31v-10.86h4.03c2.69,0,3.95,1.34,3.95,3.51,0,1.64-.75,2.84-2.16,3.21l2.61,4.14h-2.46l-2.32-3.77ZM604.56,106.3h1.64c1.27,0,1.64-.67,1.64-1.87s-.37-1.72-1.64-1.72h-1.64v3.59Z'/%3e%3c/svg%3e)
This guide explains how to enable debug logging in the Innoactive Spatial app on Apple Vision Pro and export the logs for troubleshooting.
Overview
The Innoactive Spatial client for Apple Vision Pro includes a built-in debug logging system that captures system events, network activity, and error details. These logs are invaluable when diagnosing connection issues, streaming problems, or unexpected behavior.
Logs are automatically captured in the background and cleared after 24 hours.
For OS-level issues — for example a crash or the app failing to launch — the in-app logger may not have data. In those cases pull visionOS system-level logs instead; see Obtaining visionOS system-level logs and crash reports below.
Prerequisites
- Innoactive Spatial app installed on your Apple Vision Pro
- No active streaming session is required (logging works at all times)
Step-by-Step Instructions
Step 1: Open Settings
From the main screen of the Innoactive Spatial app, tap the gear icon in the top-right corner of the window to open the Settings panel.
Step 2: Navigate to Debug Mode
In the Settings panel, scroll down and tap Debug Mode (listed under "Development and troubleshooting"). This will open the Debug Mode settings screen.
Step 3: Enable Debug Mode
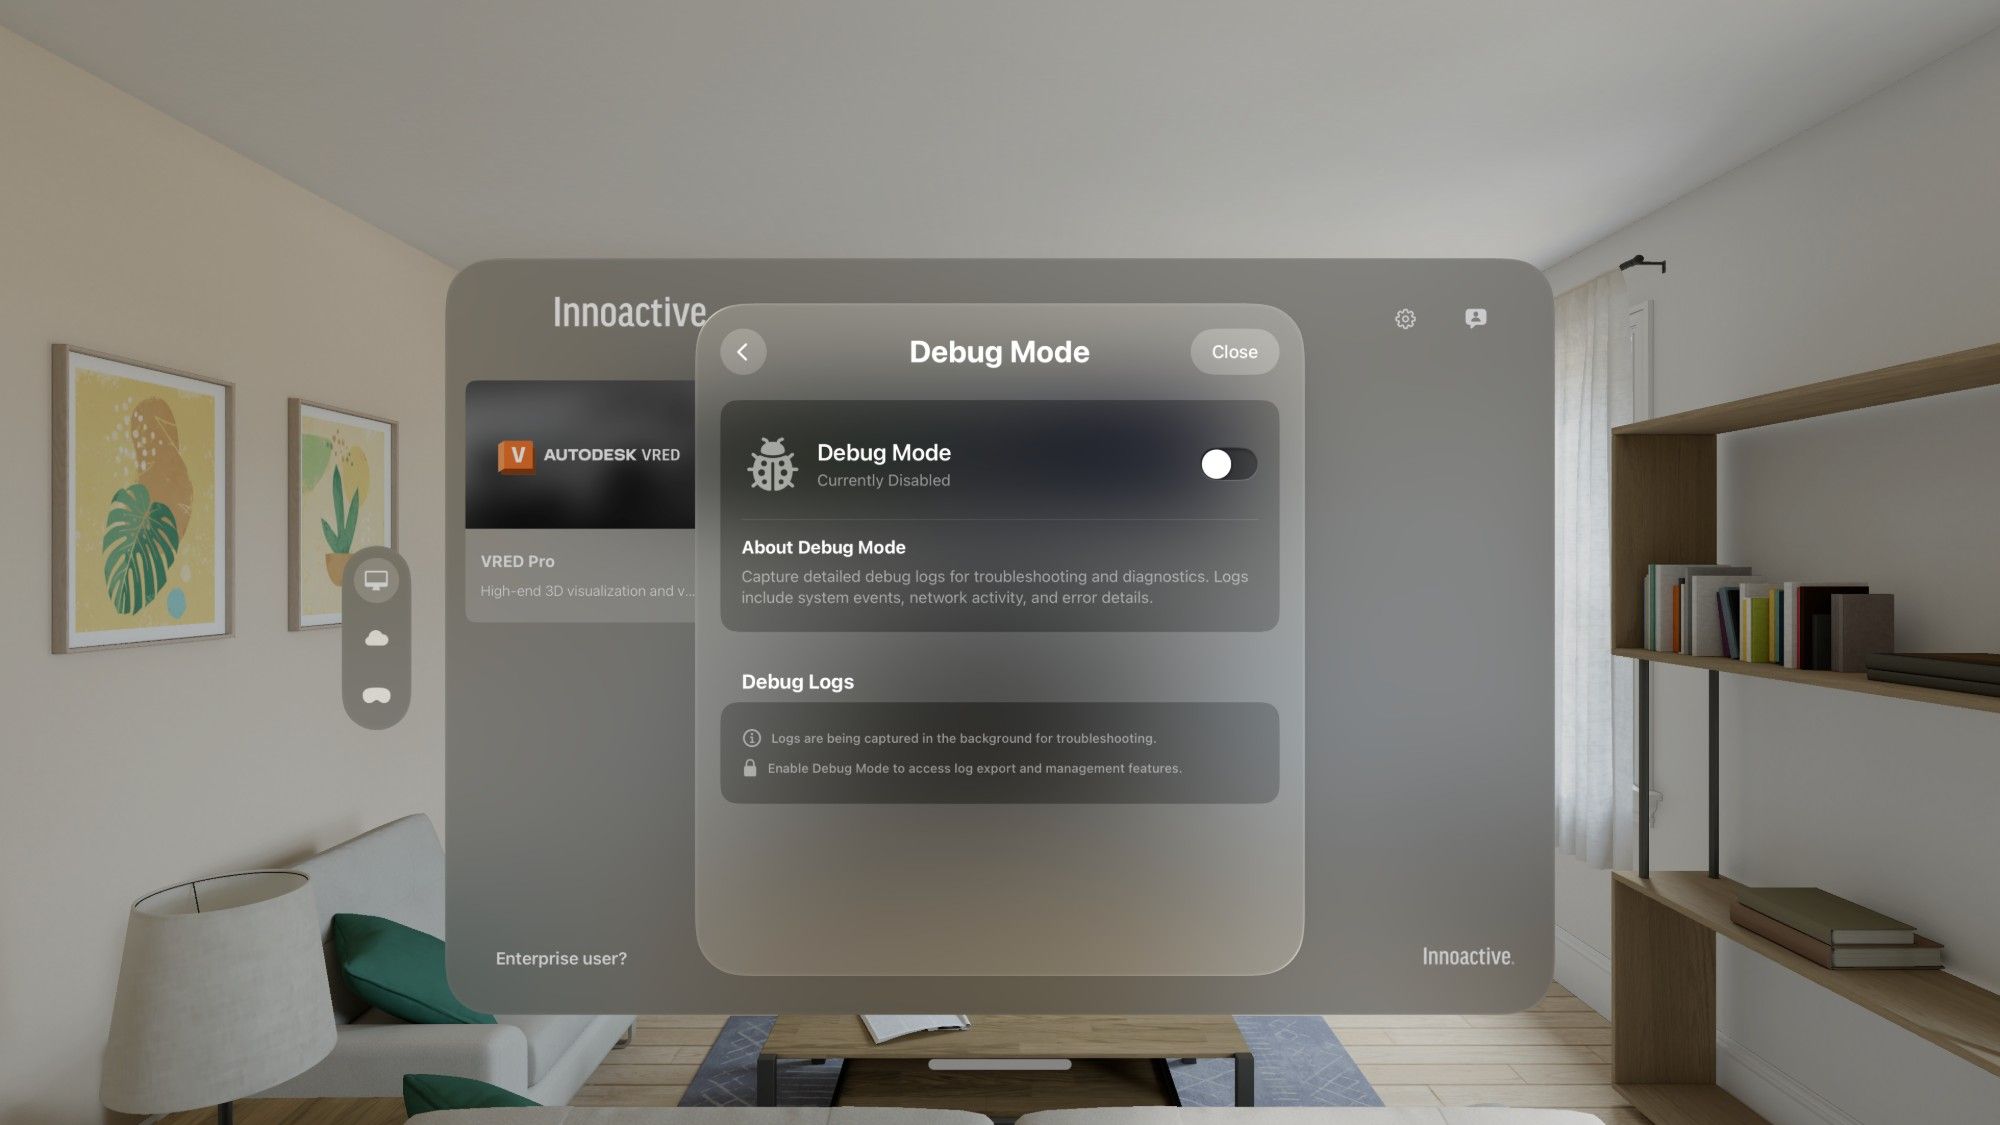
At the top of the Debug Mode screen, you will see a Debug Mode toggle with a bug icon. If it shows "Currently Disabled", tap the toggle to enable it.
When Debug Mode is disabled, you will see an informational message:
- "Logs are being captured in the background for troubleshooting."
- "Enable Debug Mode to access log export and management features."
Once enabled, the Debug Logs section will expand to show additional controls.
Step 4: Review Log Information
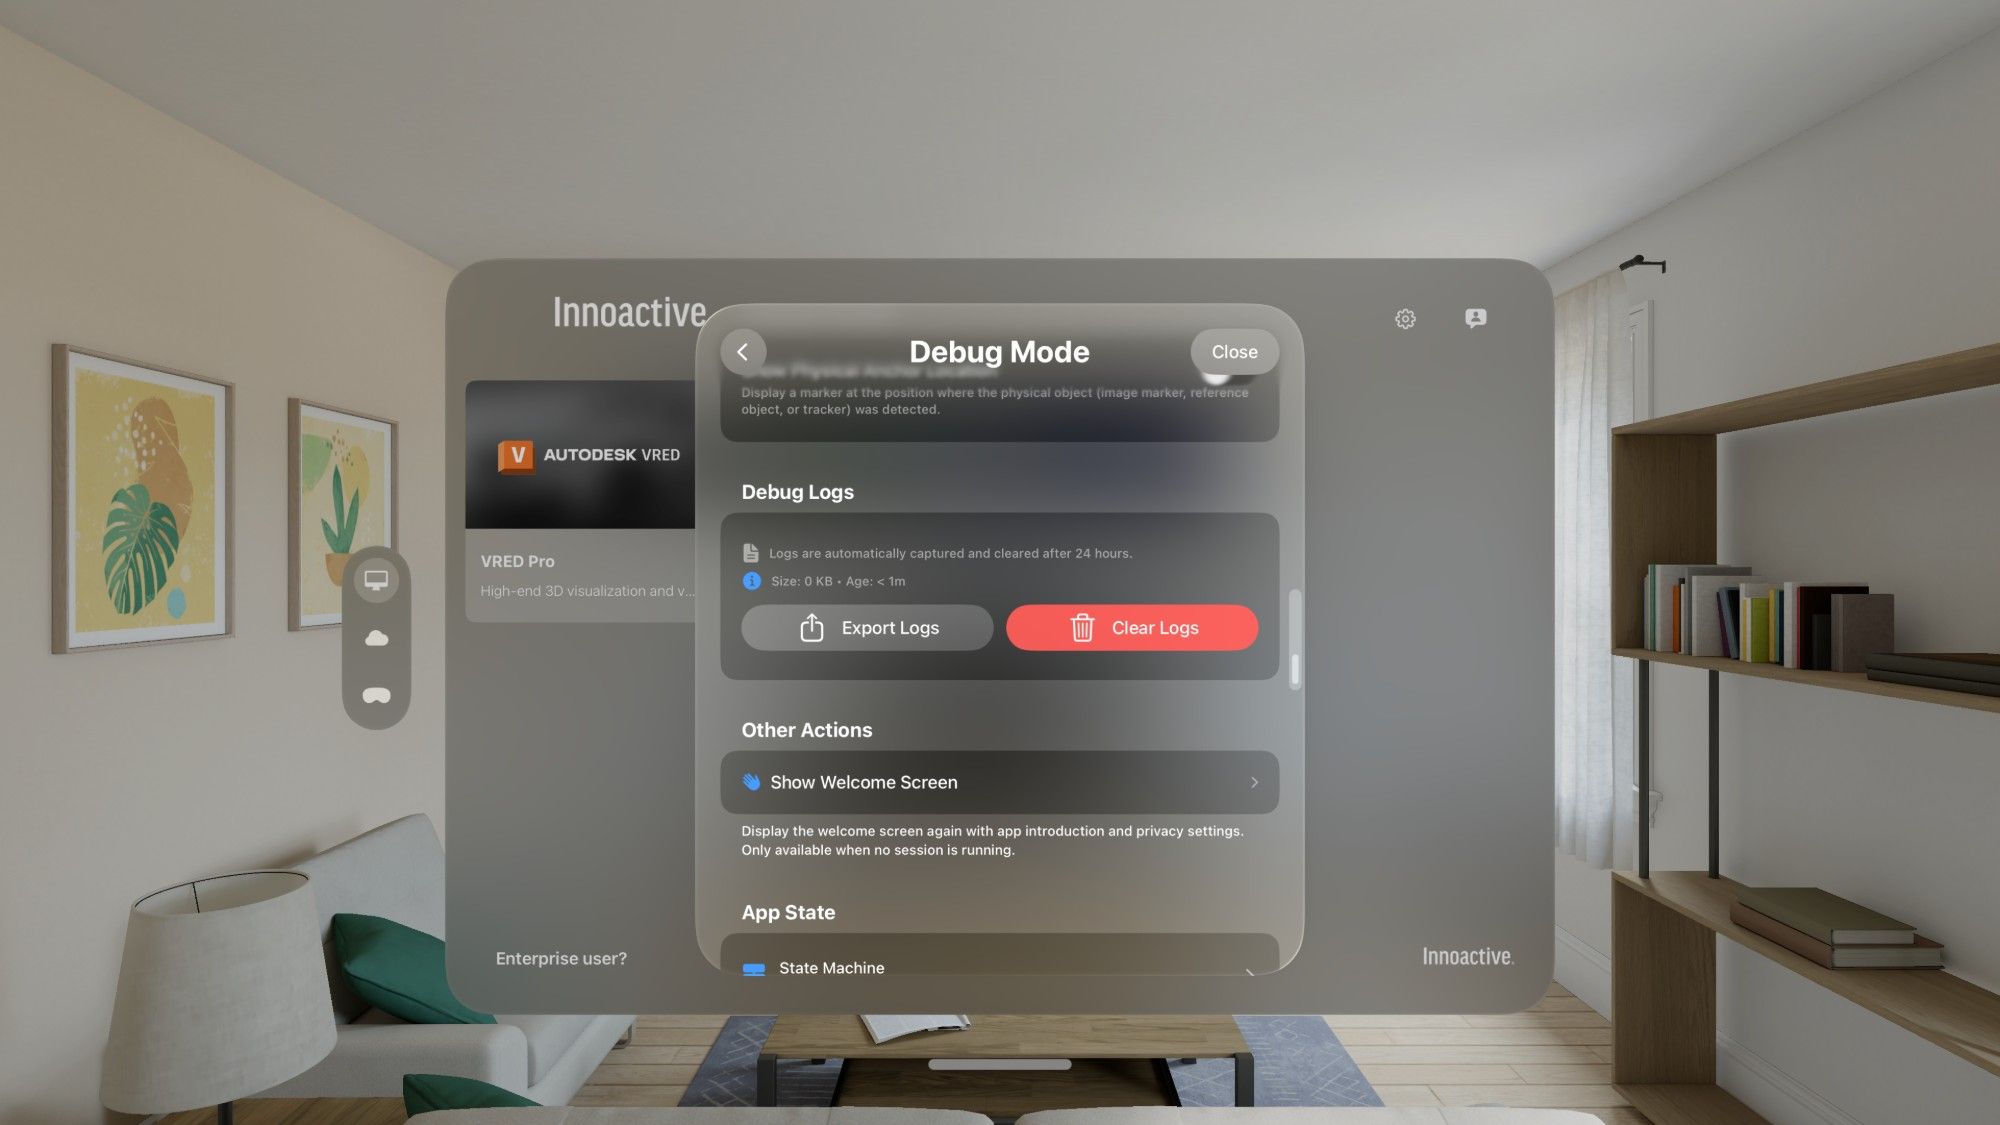
With Debug Mode enabled, the Debug Logs section displays:
- Log size — the current size of the captured log data (e.g., "0 KB")
- Log age — how long ago logging started (e.g., "Age: < 1m")
This information helps you verify that logs are actively being captured.
Step 5: Export Logs
Tap the Export Logs button (with the share icon) to export the captured logs. This will open the standard visionOS share sheet, allowing you to:
- Save the log file to the Files app
- Share via AirDrop to a nearby Mac
- Send via email or other sharing methods
Step 6: Clear Logs (Optional)
If you want to start fresh, tap the Clear Logs button (red, with a trash icon) to delete all currently captured logs. This is useful before reproducing a specific issue so the exported logs contain only relevant data.
Recommended Workflow for Troubleshooting
- Open Settings → Debug Mode
- Enable the Debug Mode toggle
- Tap Clear Logs to start with a clean slate
- Close Settings and reproduce the issue you are experiencing
- Return to Settings → Debug Mode
- Tap Export Logs and share the file with the support team
Additional Debug Features
The Debug Mode screen also provides access to:
- Show Physical Anchor Locator — displays a marker at the position where a physical object (image marker, reference object, or tracker) was detected
- Show Welcome Screen — re-displays the app introduction and privacy settings (only available when no session is running)
- App State / State Machine — view the current internal state of the application
Obtaining visionOS system-level logs and crash reports
The in-app debug logger above captures the Spatial app's own runtime events. For OS-level diagnostics — most commonly when the app crashes, fails to launch, or is unresponsive — pull logs directly from visionOS. Support may ask for these alongside the in-app debug log.
Reference: Apple — Acquiring crash reports and diagnostic logs.
On the Apple Vision Pro
- Open the Settings app.
- Go to Privacy & Security → Analytics & Improvements → Analytics Data.
- Scroll the list to find entries close to the time the issue occurred. Crash reports typically use the
.ipsextension and are named after the process or bundle. - Tap an entry to open it, then use the share button to AirDrop the file, save it to Files, or send it via Mail.
Via Xcode (Mac)
If you have a Mac with Xcode and the Vision Pro paired via developer mode:
- Connect the device to the Mac.
- In Xcode, open Window → Devices and Simulators and select the Vision Pro.
- Click View Device Logs to browse crash reports, or Open Recent Logs in Finder to pull a batch at once.
This route is convenient when collecting many logs in one go, or when the on-device share sheet is impractical (e.g., debugging at a tradeshow with limited time).
Notes
- Logs are automatically captured in the background even when Debug Mode is disabled. Enabling Debug Mode simply unlocks the export and management features.
- Logs are automatically cleared after 24 hours.
- Log files may contain network addresses and session identifiers. Handle them with appropriate care.